
Survey Results
1.Respondent Demographics
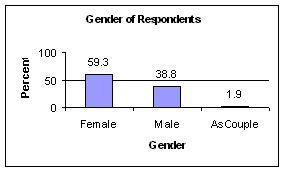
Gender
89.5% of residents responded to this question. A small number specified that they were responding as a couple. Below is a breakdown of respondents by gender:
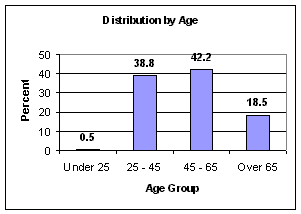
Age
Residents were asked to identify which of the following four age categories they belonged to: Under 25; 25 – 45; 45 – 65; Over 65. With 97% of residents responding to this question, the age distribution breakdown was as follows:
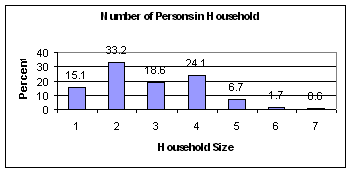
Household Size
Residents were asked to identify the size of their household. 97% of the respondents answered this question; most residents live in either a two- or four-person household.
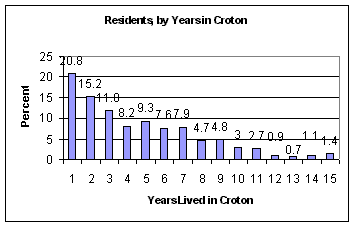
Number of Years in Croton
Residents were asked how long they have lived in Croton. To facilitate analysis, year categories were created of five-year increments. Of the 97% who responded, most (21%) have lived in Croton for less than five years, followed by 15% of respondents who have lived in the Village between five and ten years.
1 = 0 – 4.9 9 = 40 – 44.9
2 = 5 – 9.9 10 = 45 – 49.9
3 = 10 – 14.9 11 = 50 – 54.9
4 = 15 – 19.9 12 = 55 – 59.9
5 = 20 – 24.9 13 = 60 – 64.9
6 = 25 – 29.9 14 = 65 – 69.9
7 = 30 – 34.9 15 = 70 – 75
8 = 35 – 39.9
2. Resident Preferences
Residents were asked to identify what three characteristics of Croton they like the best and the least and to identify the reasons they like or dislike their part of the Village. Village character and open space amenities were cited most frequently as positive aspects of Croton, while sidewalks appears very frequently as a negative aspect on both a Village-wide and neighborhood level.
| Rank | Characteristic | Frequency | Percent |
| 1 | Small town character | 659 | 69.4 |
| 2 | Hudson/Croton riverfronts | 650 | 68.4 |
| 3 | Parks & open space | 376 | 39.6 |
| 4 | Regional rail & road access | 373 | 39.3 |
| 5 | Residents' volunteerism & participation | 192 | 20.2 |
| 6 | Artistic community | 131 | 13.8 |
| 7 | Diverse population | 127 | 13.4 |
| 8 | Greenery/Tree City USA | 111 | 11.7 |
| 9 | Water Quality | 105 | 11.1 |
| 10 | Proximity to employment centers | 67 | 7.1 |
| 11 | Other | 60 | 6.3 |
| 12 | Cultural opportunities | 17 | 1.8 |
| Rank | Characteristic | Frequency | Percent |
| 1 | Sidewalk condition/lack of sidewalks | 363 | 38.6 |
| 2 | Rate/pattern of new development | 341 | 36.2 |
| 3 | Appearance of commercial areas | 310 | 32.2 |
Below is a summary of the remaining choices.
| Rank | Characteristic | Frequency | Percent |
| 4 | Housing opportunities/rising costs | 293 | 31.1 |
| 5 | Quality of commercial uses and centers | 286 | 30.4 |
| 6 | Other | 285 | 30.3 |
| 7 | Lack of recreational facilities for kids | 209 | 22.2 |
| 8 | Speeding traffic | 205 | 21.8 |
| 9 | Older sewer and water systems | 145 | 15.4 |
| 10 | Inadequate car parking | 105 | 11.2 |
| 11 | Traffic congestion | 83 | 8.8 |
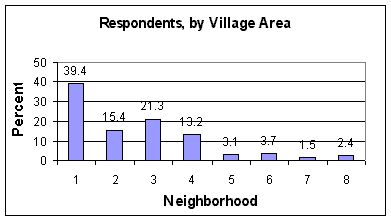 The 769 “yes” survey responses (the number of respondents who answered “yes” to whether they like their part of the Village) were then analyzed for the reasons for that response. Across all eight neighborhoods, the most frequently selected strengths were the attractiveness of the neighborhood and the proximity to open space and/or the waterfront. Convenience factors, such as proximity to schools or work, were often noted as well.
| Key | |
| 1 = Harmon | 5 = Route 129 Area |
| 2 = Mount Airy/Trails | 6 = North Riverside Area |
| 3 = Upper Village | 7 = North Highland/Riverlanding |
| 4 = North End | 8 = Half Moon Bay |
The three most frequently selected reasons are listed below by neighborhood. The number in parentheses reflects the number of respondents from that neighborhood.
- Harmon (302): Attractive Area (67%); Close to Schools (52%); Near Community Facilities (45%)
- Mount Airy/Trails (118): Attractive Area (85%); Rural Area (64%); Close to Open Space/Riverfront (37%)
- Upper Village (165): Attractive Area (55%); Close to Open Space/Riverfront (49%); Near Community Facilities (47%)
- North End (101): Attractive Area (78%); Close to Open Space/Riverfront (49%); Convenient to Work (26%)
- Route 129 Area (24): Attractive Area (75%); Close to Open Space/Riverfront (58%); Rural Area (42%)
- North Riverside Area (28): Close to Open Space/Riverfront (71%); Attractive Area (50%); Close to Family & Friends/Affordable Area tied (32%)
- North Highland Riverlanding (11): Attractive Area (91%); Close to Schools/Close to Open Space & Riverfront tied (46%); Rural Area (36%)
- Half Moon Bay (20): Close to Open Space/Riverfront (90%); Attractive Area (85%); Convenient to Work (50%)
- crowding of houses and lack of open space
- lack of housing maintenance and code enforcement
- noise
- too many cars
- lack of sidewalks
From the Upper Village, the twelve (12) complaints focused primarily on speeding traffic and congestion, noise level, congestion and lack of shopping alternatives. Mount Airy and North End both cited speeding traffic and noise. Mount Airy also addressed poor road conditions and no local shopping; North End residents cited diesel engines and the lack of a local park.
The survey included a section where residents were asked to provide their ideas on Croton’s character and future development. Over 500 written responses were received which addressed a wide range of issues. While responses were too numerous to include in this report, a summary of responses by topic is provided below.